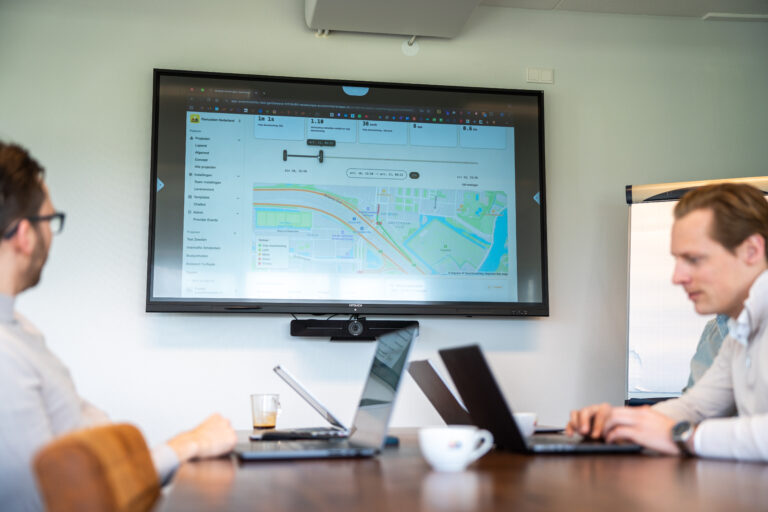
Floating car data: the invisible source behind reliable traffic measurements
Anyone wanting to know about traffic flow on a road today no longer has to wait for a manual count or a loop in the asphalt. Millions of vehicles continuously transmit their location, speed, and direction to navigation systems and apps. This stream of data is called floating car data (FCD), and it has become one of the most important sources behind us. platform for traffic measurements.
What is floating car data, actually?
The term sounds more technical than it is. Any vehicle with a GPS receiver on board—often simply a phone with a navigation app or built-in navigation in the dashboard—acts as a mobile sensor. A so-called “probe.” This probe periodically sends location and speed data to a central server. By adding up thousands of these probes, a detailed picture of travel times, average speeds, and origin-destination patterns on a road section emerges, without the need for a physical measurement setup.
The major advantage over traditional measurement methods such as loops, cameras, or convoy counts is the coverage. Whereas a loop or camera registers only one point in the network, Floating Car Data in principle provides insight into an entire urban or regional road network, including the underlying roads where cut-through traffic emerges as soon as a main route is closed.
Why is FCD relevant in temporary traffic situations?
During roadworks, events, or other temporary traffic measures, that broad picture is exactly what is needed. A closure on one road almost always leads to diversion behavior elsewhere: navigation apps automatically direct road users through residential areas or secondary routes as soon as a main road temporarily has reduced capacity. This leads to inconvenience, complaints, and sometimes administrative pressure, while the supporting data for this is often lacking.
Floating car data makes that effect visible. You see not only how traffic flow on the closed route changes, but also where the diverted traffic goes, how much delay that causes, and how this pattern develops over time. That is precisely the kind of insight that makes traffic measures explainable to the administration, residents, and other stakeholders.
The connection with traffic measurements from Ramudden Smart Mobility
Within the service Traffic measurements This type of data source plays a central role at Ramudden Smart Mobility. Instead of relying on a snapshot, road authorities, contractors, and consultancy firms can use FCD-based measurements to continuously monitor the actual impact of a temporary situation on traffic: before, during, and after the work. This aligns with what Ramudden Smart Mobility stands for: targeted information and traffic management that aligns with both policy and practice, ensuring that traffic measures are better understood and followed by road users.
Some practical applications resulting from this:
- Provide substantiation in advance. With historical and current travel time data, you can quantify the expected impact of a closure even before the first cone is in place.
- Adjusting during the work. If delays on a diversion route become excessive, this is immediately visible. This is a reason to adjust communication, navigation influence, or physical measures.
- Justify afterwards. Afterwards, the data shows what the actual effect has been, which is useful for the evaluation and for future projects.
That also ties in directly with our other solutions, such as navigation influenceIf you know, based on FCD, that road users are driving en masse via an unwanted shortcut, you can intervene specifically in the routes suggested by navigation apps.
A side note: not a miracle cure
Floating car data is strong exactly where it really matters: the Institute for Mobility Policy confirms that FCD is excellently suited to identifying accessibility bottlenecks, and that strength is only growing. The more people use navigation apps and smartphones, the more granular and reliable the picture becomes. FCD is therefore an excellent basis for travel times and speeds, the core of good traffic measurement.
And that is precisely where the added value of a well-designed platform lies: by smartly combining FCD with supplementary sources, such as local counts or data from the National Road Traffic Data Bank (NDW), a traffic picture emerges that is not only comprehensive but also accurate down to the last detail, including reliable intensities. Exactly the coverage and currency of FCD, supplemented with the right sources in the right place.
In short
Floating car data has made traffic measurements fundamentally more accessible: expensive fixed infrastructure is no longer needed to monitor an entire network. For road authorities and contractors relating to temporary traffic situations, this means that choices regarding diversions, communication, and measures no longer need to rely on gut feeling, but on continuously updated, factual insights into how traffic actually behaves.